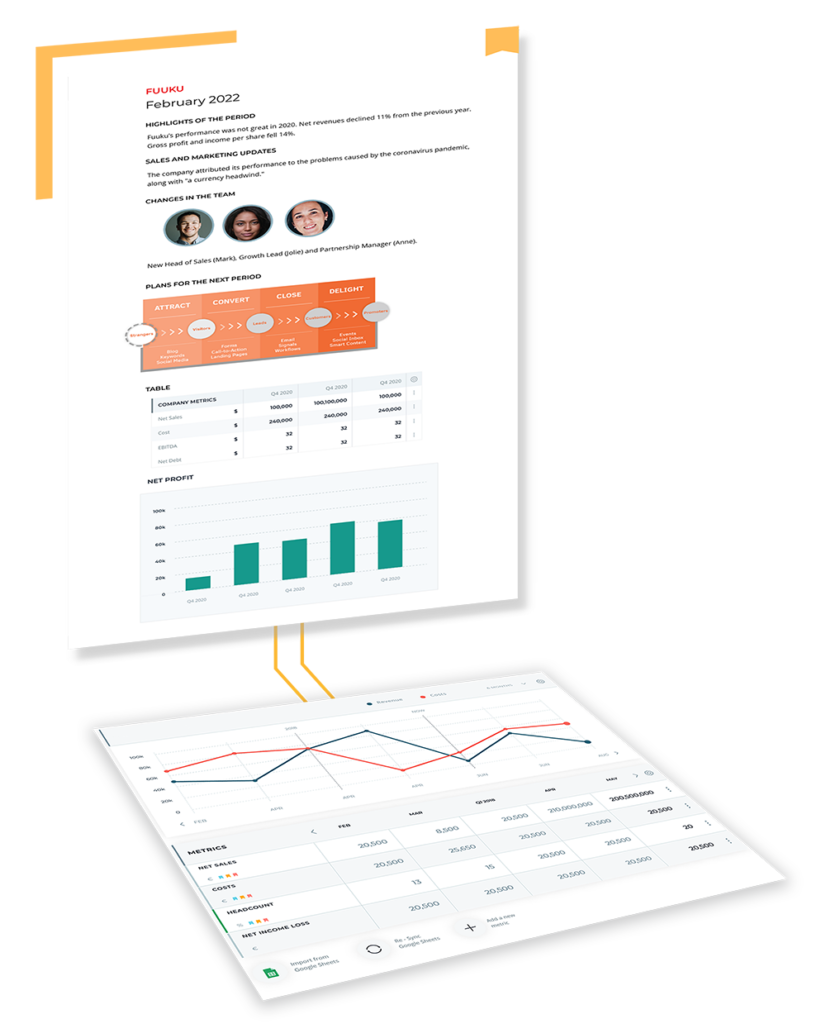
In the vibrant and competitive world of e-commerce, having a firm grasp on key metrics is vital for startups looking to demonstrate value to investors. These metrics provide a snapshot of your e-commerce company’s performance, customer behavior, and financial health. In this blog post, we’ll delve into 7 essential metrics that you should include in your investor reports:
Revenue
Revenue is the lifeblood of any business. It represents the total sales generated over a specific period and is the starting point for analyzing financial performance. For investors, consistent revenue growth is often seen as a positive sign that the business is capturing market share and that its products or services are in demand.
Revenue = Sum of all sales (excluding returns and discounts) during a specific period.
Gross Profit Margin
Gross profit margin is a key indicator of how efficiently your business is operating. It tells you the percentage of revenue exceeding the cost of goods sold. A high gross profit margin indicates that your company is efficiently managing its production costs and pricing strategies.
Gross Profit Margin (%) = [(Revenue – Cost of Goods Sold) / Revenue] x 100
Customer Acquisition Cost (CAC)
CAC represents the average cost to acquire a new customer through marketing and sales efforts. This metric is essential as it helps assess the efficiency of marketing campaigns. A low CAC implies that the business is acquiring customers efficiently, while a high CAC may suggest that marketing strategies need refinement.
CAC = Total Cost of Sales and Marketing / Number of Customers Acquired
Lifetime Value (LTV)
LTV estimates the total revenue a customer will generate during their entire relationship with the company. A high LTV implies that customers find value in your products, leading to repeat purchases and potentially higher profitability.
LTV = (Average Revenue per User x Gross Margin) / Churn Rate
LTV:CAC Ratio
This ratio is an invaluable metric for understanding the relationship between the lifetime value of a customer and the cost of acquiring them. A ratio higher than 1 suggests that the company is acquiring customers profitably, while a ratio lower than 1 could indicate that customer acquisition is too costly compared to the revenue they bring.
LTV:CAC Ratio = Lifetime Value / Customer Acquisition Cost
Average Order Value (AOV)
AOV tracks the average amount spent by customers per transaction. By monitoring AOV, businesses can understand consumer spending habits and implement strategies to encourage higher spending, such as upselling or bundling products.
AOV = Total Revenue / Number of Orders
Cash Burn Rate
Especially important for startups, the cash burn rate indicates how quickly the company is spending its cash reserves. Investors pay close attention to this metric as it gives them an idea of the company’s runway, or how much time it has before it needs to either become profitable or raise additional funds.
Cash Burn Rate = (Cash Balance at the Beginning of the Period – Cash Balance at the End of the Period) / Number of Months (or Quarters) in the Period
Want to make investor reporting hassle-free? Look no further than Rundit’s investor reporting tool. Our platform offers comprehensive investor reporting features, making the process of startup investor reporting a breeze:

Having a solid understanding of these key metrics will not only help e-commerce startups to monitor and improve their own performance but will also enable them to effectively communicate their value to investors. Remember that the most successful e-commerce companies are data-driven, and using these metrics as a foundation for decision-making can be a game-changer for growth and sustainability.

Conveniently share business updates with all your investors from one single platform.