Table of Contents
Owning 30% of a company does not mean receiving 30% of the exit. Between the headline price and the money that reaches your fund sits the exit waterfall: liquidation preferences, participation rights and conversion decisions. Then, between your fund and each LP sit allocations, fees and returns. If your team rebuilds that chain in spreadsheets every time an exit is on the table, every LP question about “what does this mean for me?” costs you days.
Airtable is a timely example. Investors valued it at $11 billion before its $735 million Series F in December 2021. In September 2026, Bending Spoons completed its acquisition of Airtable, agreed at an enterprise value of $1.285 billion, implying an equity value of approximately $2.25 billion once Airtable’s net cash is included. For everyone on the cap table, the question is not what Airtable is worth. It is who gets what.
This guide explains how an exit waterfall works, how proceeds flow from a portfolio company to the fund and on to individual LPs, and where fund managers lose time and accuracy along the way.
A cap table records ownership, not economic outcomes. It shows shareholders, share classes, ownership percentages, and dilution, but the payout at exit depends on the rights attached to each security.
After several financing rounds, a company can carry multiple classes of preferred shares, each with its own liquidation preference, participation rights, conversion rights and anti-dilution terms. Add an employee option pool, SAFEs, warrants and convertible notes, and the same 20% stake can be worth very different amounts depending on what that 20% actually is. This is where cap table management turns into distribution modelling.
An exit waterfall is the order in which sale proceeds are paid out to shareholders. Holders with liquidation preferences are paid first, up to their preference amount, and the remainder is distributed according to each class’s participation and conversion rights.
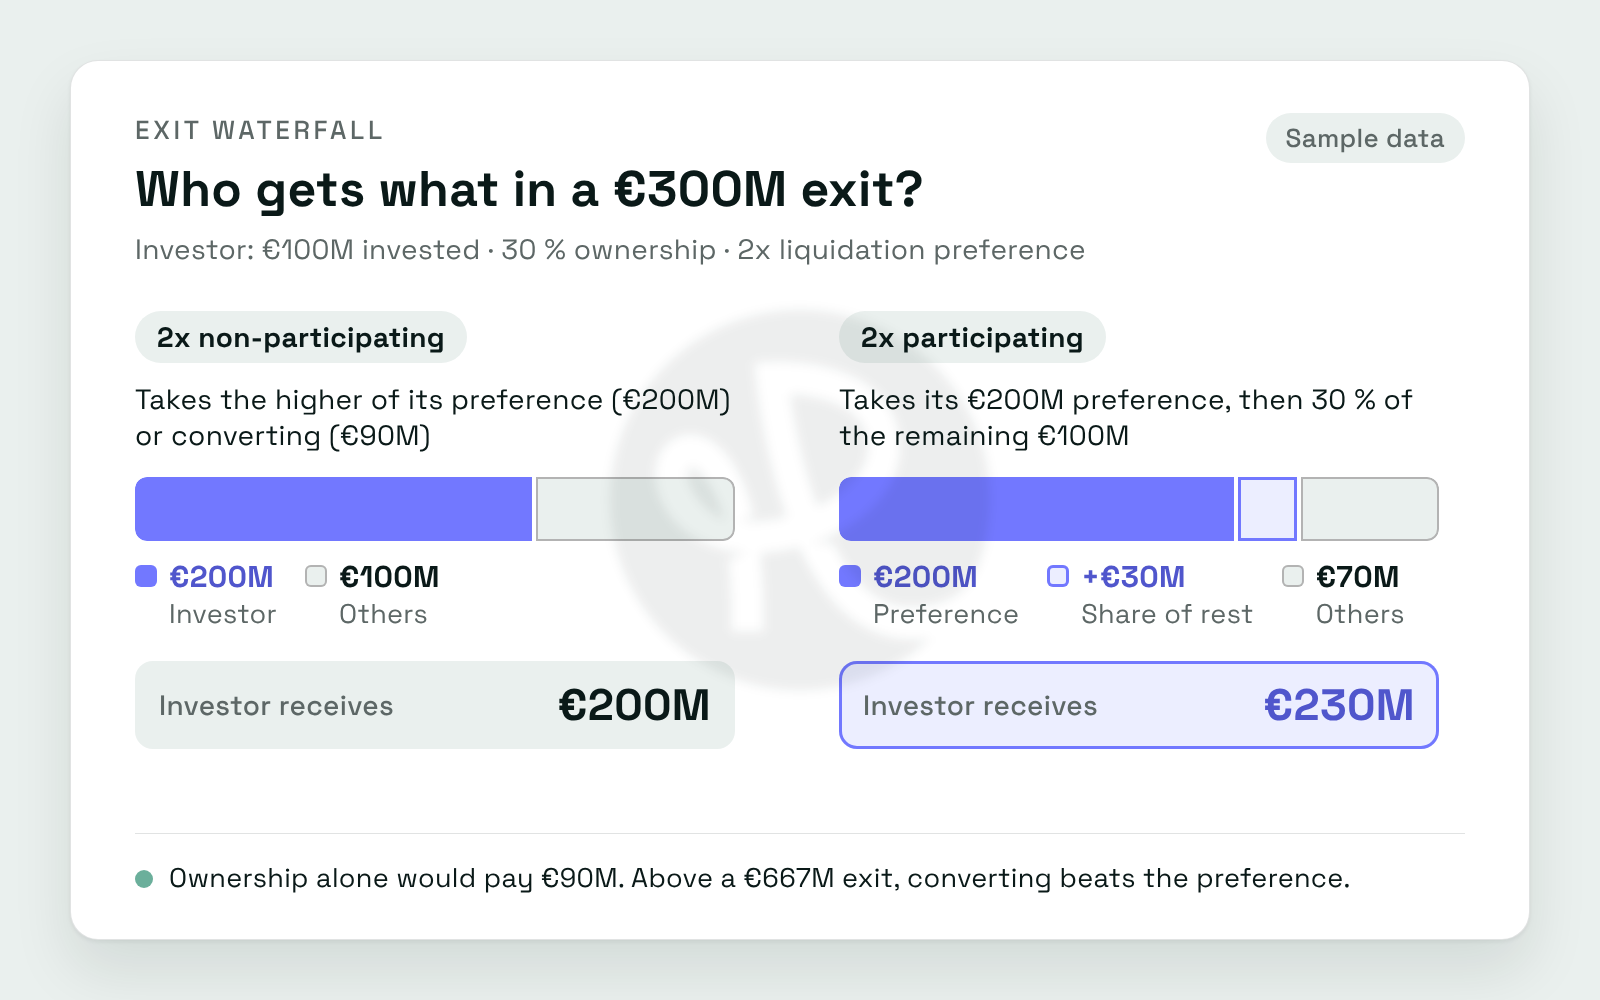
Take a simplified example. A fund invests €100 million for 30% of a company, with a 2x liquidation preference, so the preference is worth €200 million. The company is sold for €300 million. On ownership alone, the fund would receive €90 million. The type of preference changes that number considerably.
With a non-participating preference, the investor chooses either its preference or conversion to ordinary shares, whichever pays more.
In this example, the investor converts once 30% of the exit value exceeds the €200 million preference: an exit of roughly €667 million. Below that point, the preference protects the investor. Above it, ownership does. Knowing this breakpoint for each holding tells you which exit offers actually move your fund’s returns.
With a participating preference, the investor takes its preference first and then shares in what is left according to its ownership.
Two investors with identical ownership can walk away with very different proceeds. With several rounds and share classes, calculating this by hand becomes slow and error-prone.
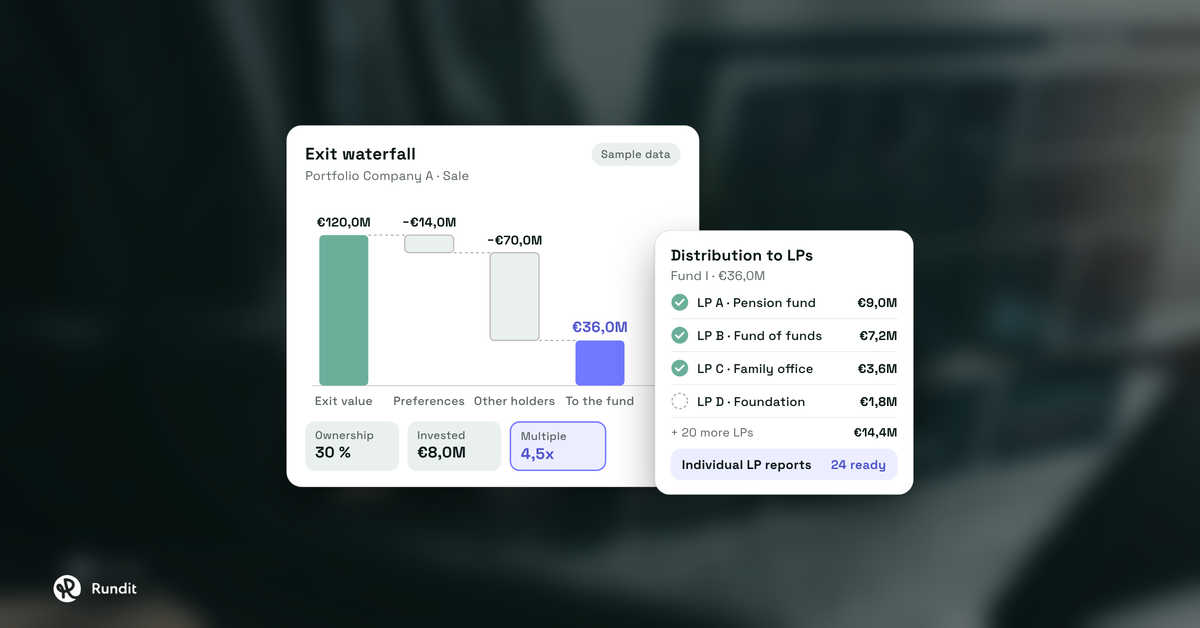
Exit proceeds move through a chain: cap table, exit waterfall, portfolio proceeds, fund cash flows, LP distributions and fund performance. Each layer depends on the one before it, so a change at company level changes what every LP receives.
For a fund with ten portfolio companies, each has its own cap table, terms and exit scenarios. The proceeds feed the fund’s cash flows, which drive distributions to LPs and investor-level metrics such as IRR, TVPI, DPI and MOIC, and potentially carried interest. LPs increasingly expect these figures to be calculated consistently: the ILPA Performance Template, which ILPA recommends implementing from Q1 2026, standardises how IRR and TVPI are reported, gross and net, with and without the impact of subscription facilities.
Connecting these layers turns the model into a scenario tool. Investment teams can test what happens if an exit slips by 12 months, if a portfolio company raises another €50 million, or if several exits land in the same year.
Most funds do not lack good models. They lack connections between them. Cap table data sits in one place, valuations in another, distribution calculations in spreadsheets, fund accounting with the administrator, and LP reporting in yet another source.
Every handoff is a chance for a stale assumption or a copy-paste error. A new financing round means updating several files. A change in exit assumptions means recalculating each one by hand, and the analyst’s time goes on moving numbers rather than checking them.
This is the gap calculated metrics in Rundit are built to close. Instead of exporting portfolio data to a spreadsheet to work out the numbers your team cares about, you create your own metrics with custom formulas, using a guided setup with calculation examples. For example, the implied value of the fund’s stake in each company, or the multiple on each holding. Results sit next to company-reported metrics in the same dashboard, and you choose how to combine them across companies. When the underlying data changes, the metric updates with it.
Fund administration is where the waterfall turns into cash. Once proceeds reach the fund, someone has to calculate each LP’s share, issue distribution notices, record payments and update capital accounts. That work usually happens in a different system from the portfolio data that triggered it.
Administration has traditionally focused on accounting, NAV calculation, reconciliation and investor servicing. As fund structures grow more complex, GPs and LPs want more than periodic statements: they want to see how a portfolio event moves through to their capital account. Administrators and in-house finance teams that connect fund-level records with portfolio, ownership and investor data can answer that directly, instead of reconciling across files.
This is why Rundit is building a fund administration module, launching soon. It brings investors, commitments, closings, capital calls, management fees and distributions into the same platform as your portfolio data, with a guided task for each step: admit investors and finalise a closing, calculate management fees and collect them through a capital call, send capital calls and review payment confirmations, and prepare a distribution, approve its notices and send them. Capital balances and the full transaction history sit in one view. When an exit lands, the path from sale proceeds to each LP’s distribution stays in one system. Join the waitlist to hear as soon as it goes live.
Show each LP their own position, not the whole register. The waterfall does not end at the fund: every LP wants to know what an exit, a distribution or a revaluation means for their own commitment, and a single report sent to everyone either over-shares or leaves them doing the maths.
The ILPA Capital Call and Distribution Template already separates LP-level cash flows from fund-level ones in every notice. Quarterly reporting is heading the same way.
Personalised LP reports in Rundit let you decide, recipient by recipient, whether an LP sees the full report or an individual version. Individual versions show the recipient’s own investor rows, with all other investors grouped into one combined total, so each LP sees their position without seeing anyone else’s. Before sharing, you can preview the report as a specific recipient and check exactly what they will see. You prepare one report, not one per investor.
Cap tables, exit waterfalls and fund models are three views of the same economic system: who owns the value, how it is allocated when it is realised, and what that means for the fund and each investor. Funds that still connect these views by hand will answer LP questions more slowly and with less confidence than funds that have automated the chain, and LPs comparing managers at re-up notice the difference.
The question is no longer “what is the company worth?” It is: who gets what, when, and what does that mean for each of your investors?
| What is an exit waterfall? | An exit waterfall is the order and method by which proceeds from the sale of a company are distributed to shareholders. Liquidation preferences are paid first, then the remaining proceeds are allocated according to participation and conversion rights. |
| What is the difference between participating and non-participating preferred shares? | Non-participating preferred holders receive either their liquidation preference or their as-converted share of proceeds, whichever is higher. Participating preferred holders receive their preference and then also share in the remaining proceeds pro rata. |
| Why does ownership percentage not equal share of exit proceeds? | Because liquidation preferences, participation rights and conversion terms change how proceeds are allocated. At lower exit values, preferred holders can receive far more than their ownership percentage suggests. |
| How do exit proceeds affect LP returns? | Proceeds from a portfolio exit become fund cash flows, which are distributed to LPs and drive metrics such as DPI, TVPI and IRR. Each LP’s share depends on their commitment and the fund’s distribution terms. |
To see how Rundit connects portfolio data, fund administration and investor reporting, book a discovery call.
Resources