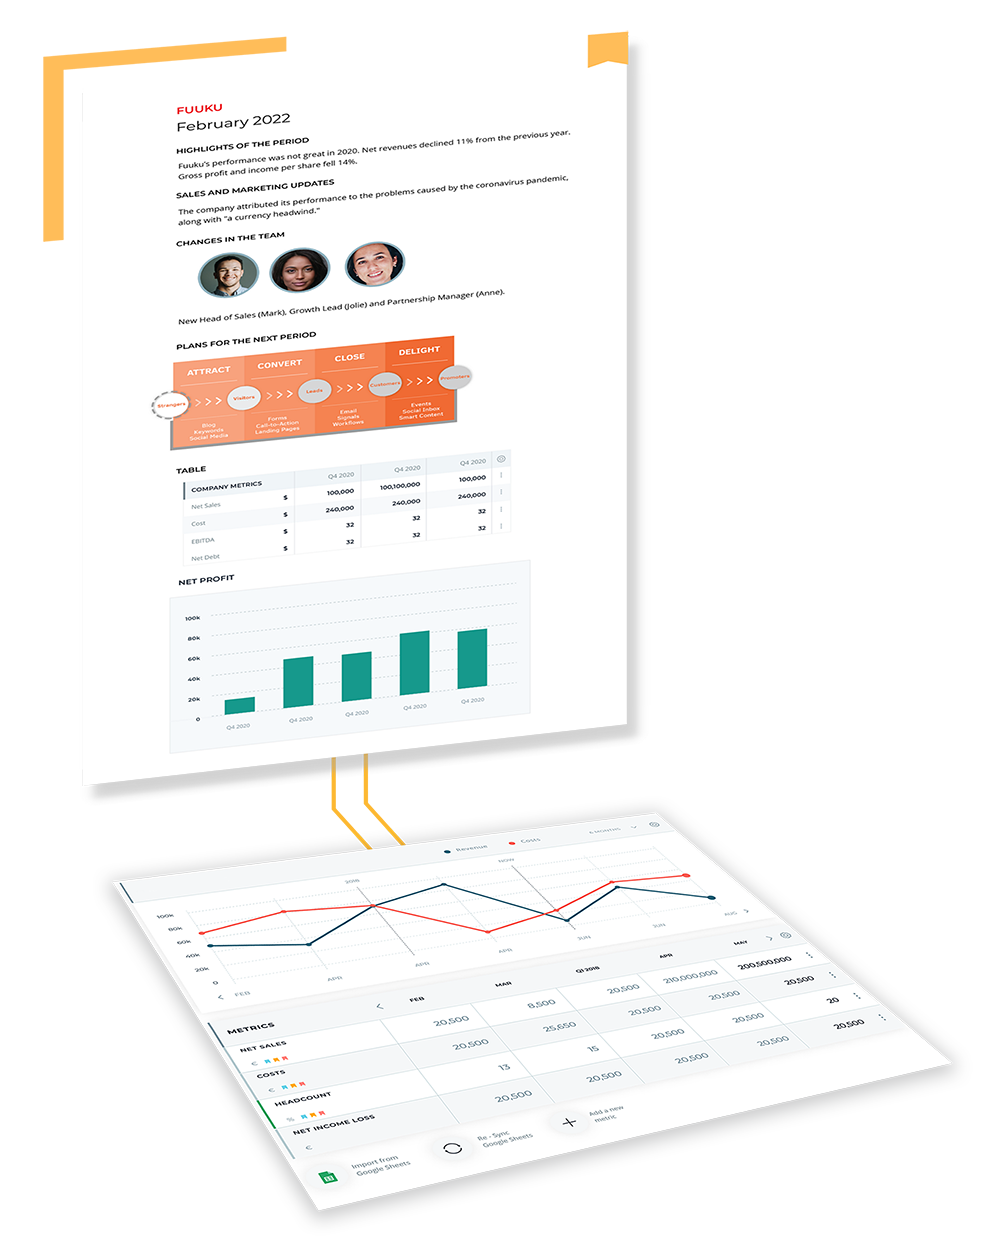
In the dynamic world of startups, where agility and adaptability are crucial, keeping your stakeholders and investors informed is not just a courtesy—it’s a lifeline.
Tracking the right metrics becomes an imperative exercise not just for the founders but also for the investors. For founders, it allows you to understand where your startup stands, which direction it’s moving towards, and how swiftly. For investors, these metrics are not just numbers—they’re stories, narratives of success, lessons from failures, and often, roadmaps to the future.
In this blog, we will delve deep into the 15 most-used metrics in Rundit for investor reports. Each metric serves as a compass, guiding both entrepreneurs and investors towards making informed decisions and strategic adjustments. Let’s decode them together.
1. Cash Balance: This is what your company has in liquid assets. Additionally, the change in the cash balance from month to month is known as your cash flow.
2. Gross burn: This is your company’s total cost of operations each month. It includes cash spent on overhead, salaries, rent, taxes, and interest.
3. EBITDA: Earnings before Interest, Taxes, Depreciation, and Amortization (EBITDA) helps display a company’s profitability. The metric can be calculated with this formula:
EBITDA = Net Income + Interest + Taxes + Depreciation + Amortization
4. Equity funding closed: This metric shows the amount of equity funding closed by your startup.
5. FTEs (Full-Time Equivalents): FTEs help determine employees’ workloads. They help companies determine wages and other expenses when paying employees by determining how many part-time employees and their worked hours add up to the same hours worked by a full-time employee.
6. Headcount: This is simply your company’s number of employees.
7. Grant funding closed: This metric shows the amount of grant funding closed by your startup.
8. Gross Margin %: Gross Margin shows whether your sales are sufficient to cover your costs. Gross margin percentage is the difference between revenue and cost of goods sold (COGS) divided by revenue.
9. MAU – Monthly Active Users: A key metric for companies with a web presence, MAU determines how many users visited a company’s website or application in a given month.
10. MRR – Monthly Recurring Revenue: This metric displays a company’s predictable revenue each month. It helps subscription-based businesses predict how much money they’ll receive each month while accounting for dissimilar subscription terms.
11. Net Burn Rate: Net Burn Rate is the difference between cash out and cash in. Profitable companies have a negative net burn rate because they are bringing in more than they are spending.
Net burn rate = (Operating expenses + COGS) – Revenue
12. Net Sales: Net sales can be found in the direct costs section of a company’s income statement. The formula for calculating net sales is as followed:
Net sales = Gross sales – Returns – Allowances – Discounts
13. Revenue: Also known as gross sales, revenue refers to a company’s total income generated through sales.
14. Runway: This metric helps startups financially plan by determining how many months they can keep operating before running out of money. You can calculate runway by dividing your cash balance by your net burn rate.
15. Total Number of Customers: This metric shows the number of new customers a startup has each month.
Want to make investor reporting hassle-free? Look no further than Rundit’s investor reporting tool. Our platform offers comprehensive investor reporting features, making the process of startup investor reporting a breeze:

Ready to create your own investor report? Try Rundit’s investor reporting for free today.

Conveniently share business updates with all your investors from one single platform.