Table of Contents
Effective portfolio management in venture capital is an art that balances risk, potential, and strategic insight. As investors strive to maximize returns and nurture promising startups, skillfully managing a diverse portfolio becomes crucial. This guide explores the key components, best practices, and innovative approaches defining successful VC portfolio management in today’s dynamic startup ecosystem.
The era of investment decisions based solely on intuition is over. Modern VC investors now rely on data and sophisticated portfolio management tools to gain critical insights into investment performance. By harnessing data analytics and visualization, investors can uncover hidden trends, patterns, and correlations, enabling more informed and objective decision-making.
This blog will demonstrate how you can enhance the portfolio management process for VCs, PE firms, and Family offices, regardless of whether you’re an emerging fund or managing multiple funds. We’ll explore how leveraging data can help you evaluate potential risks and rewards associated with each investment, ultimately leading to more strategic and successful portfolio management.
The key metrics you choose to evaluate will largely depend on your specific goals, investment strategy, and the nature of the businesses in your portfolio. Identifying the most relevant performance metrics is, therefore, a crucial step in the process.
Learn more about the 15 most-reported metrics in Rundit; Metrics for E-commerce startups and metrics for Impact startups.
By monitoring these and other relevant metrics, you can gain a better understanding of how your portfolio is performing and where adjustments may need to be made.
It’s vital that you establish a reporting framework with your portfolio companies. This could be in the format of reports (PDFs, spreadsheets, presentations,…) and the reporting period can be monthly, quarterly, and annual reports. The reports should include companies’ financial metrics, operational metrics, and key performance indicators (KPIs).
While collecting data is a crucial first step, effectively centralizing data is what unlocks its true value. However, in reality, VC teams are often slowed down by scattered data because they spend so much time either chasing portfolio companies for the data they need or aggregating data that lives in different spreadsheets.
A portfolio monitoring tool like Rundit can aid in collecting, organizing, and consolidating portfolio data into a single, reliable source. It can also facilitate the presentation of your data through charts and visual dashboards at either the company or portfolio level. Rundit provides functionalities that allow direct data input or upload from portfolio companies. Consider the following two options when importing company data into Rundit:
Once you’ve collected and processed your data, the next step is to transform it into actionable insights. This is where data visualization comes into play. By turning complex data sets into charts and graphs, you can glean insights more quickly and efficiently.
Dashboards are a common tool used for data visualization. They allow you to monitor multiple metrics at once and track changes over time. Well-designed dashboards can highlight areas of concern, celebrate successes, and facilitate data-driven discussions among stakeholders.
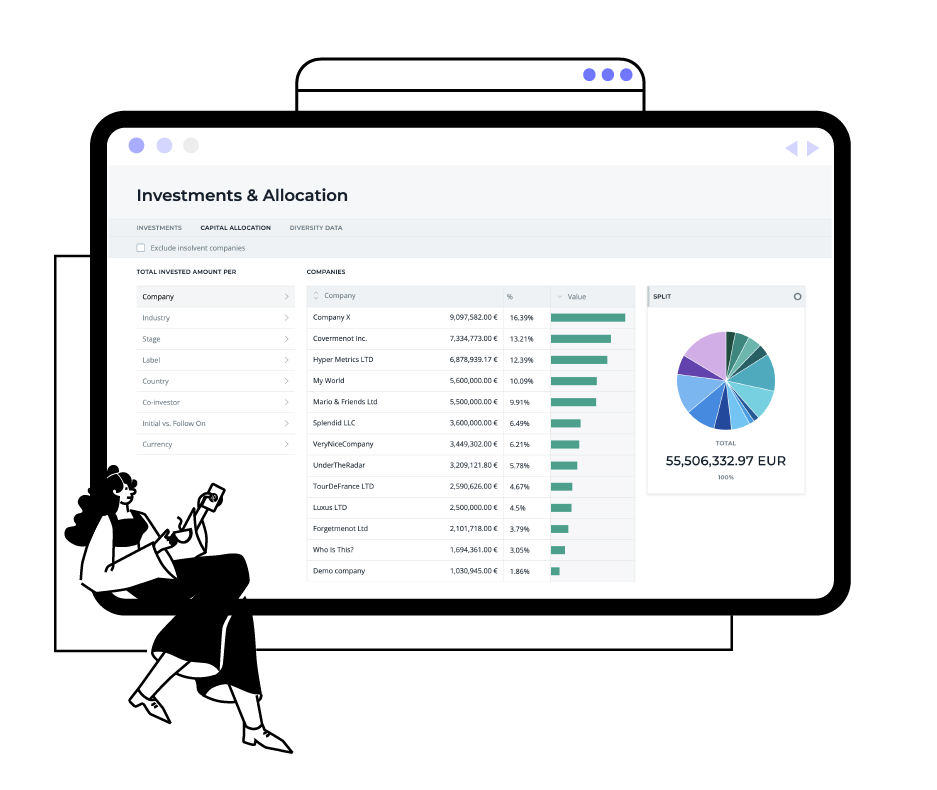
For example, to get an overview of portfolio performance as a whole, you can utilize Rundit’s Portfolio performance dashboard where you benchmark portfolio performance based on significant KPIs:
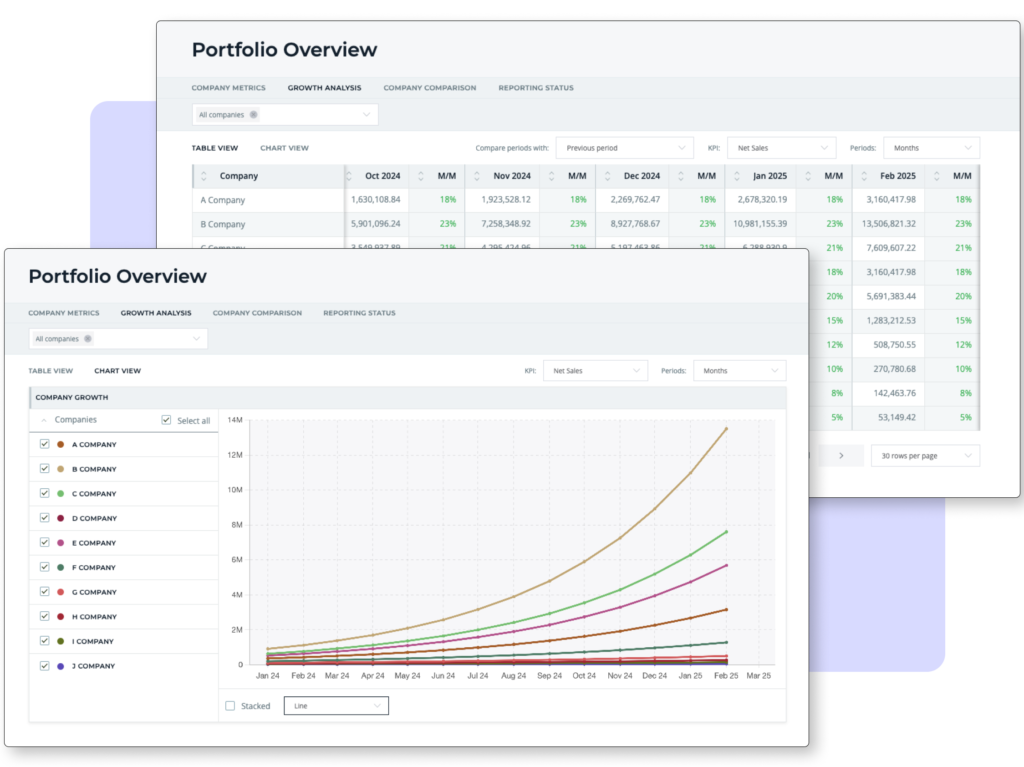
Rundit’s Portfolio performance dashboard (portfolio level)
For a more in-depth analysis of an individual company, simply navigate to its profile. Here, you’ll find consolidated performance charts, KPIs, and reports in one convenient place. According to our customers, these charts can highlight issues immediately, enabling your team to provide timely support to your company:
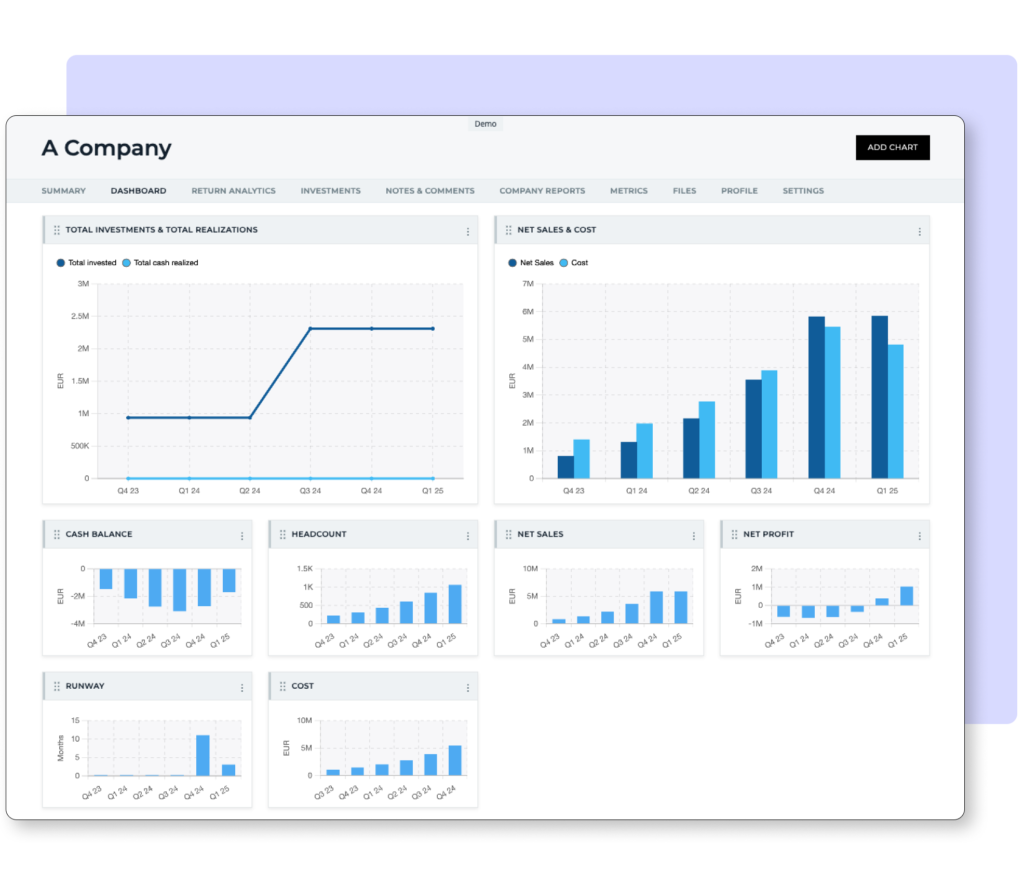
Rundit’s company performance dashboard (company level)
VCs typically calculate and track investment metrics, namely IRR, ROI, multiple, and Fair value using spreadsheets or dedicated portfolio management software.
-> Check out fund performance metrics
As a portfolio management tool, Rundit can store historical data of your transactions, calculate metrics, and generate charts at the company or fund level to help you understand the performance of investments over time (as seen in the pics below). The dashboard might also show significant changes in these metrics so you can promptly address any issues.
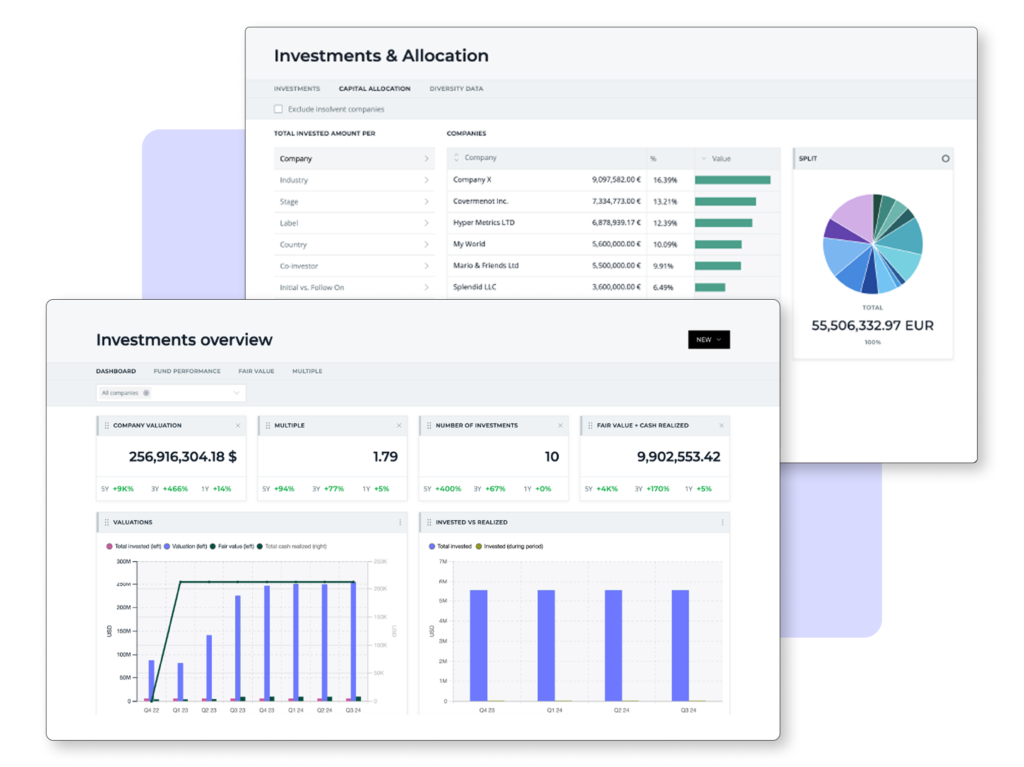
Rundit’s investment overview dashboard
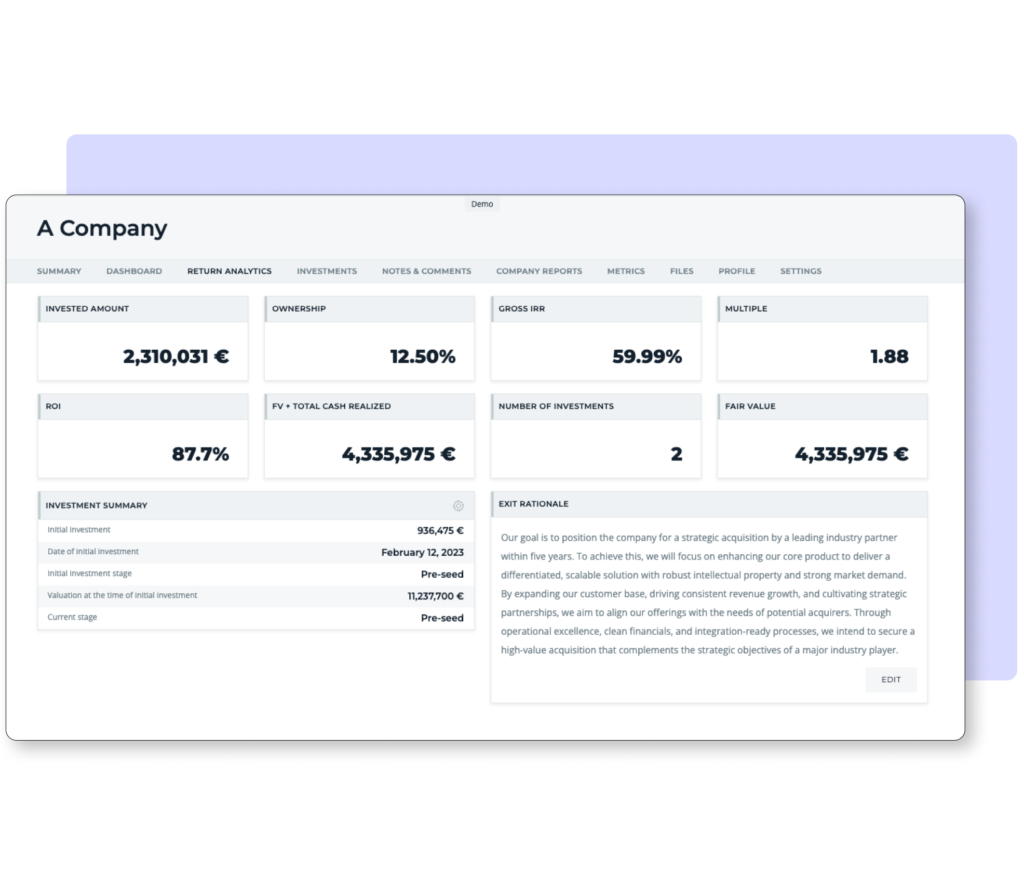
Rundit’s investment returns dashboard at the company level
Depending on the VC’s culture, size, and investment strategy, you might need different types of reports, both for their own use and to communicate with your internal team, board members, or your investors (Limited Partners, or LPs). Here are some common types of reports:
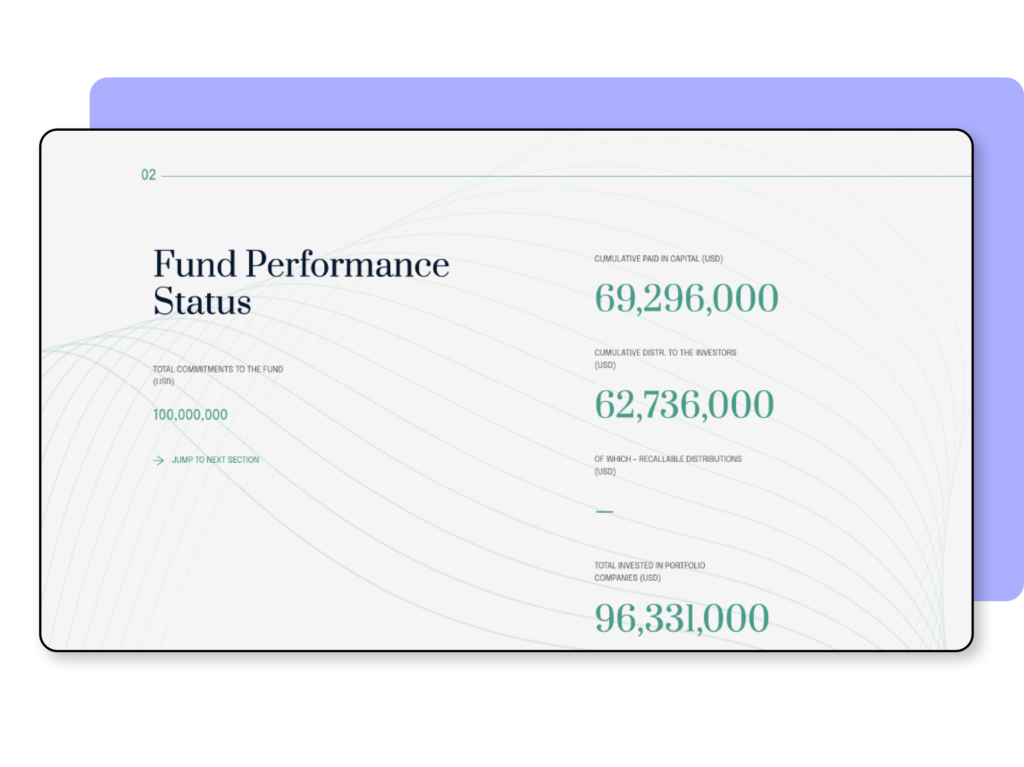
Rundit’s LP Report
Given the high stakes, complexity, and fast-paced nature of venture capital, a streamlined data flow is not just beneficial but necessary for the successful operation of a VC firm. A streamlined data flow refers to the efficient and seamless collection, processing, and analysis of data, extending from portfolio companies at the outset to your Limited Partners (LPs) at the finish line. This process is instrumental in assessing the health of your portfolio. It furnishes you with the necessary information to make timely, well-informed decisions and optimize your investment strategies for long-term success.
In conclusion, the importance of a data-driven approach to portfolio management cannot be overstated. By leveraging key metrics, effective data collection and management, data visualization and reporting, you can gain deeper insight into your portfolio and steer your investments towards success.
For Modern Investors
Trusted by global VCs & PEs
“Rundit’s dashboards save me at least three hours from preparing internal reports every Friday,”
Elena Pikulina – Associate
“The interactive LP report has helped us reduce our report compilation time by nearly 50%,”
Tommaso Condulmari – Data Analyst
“Rundit makes my life so much easier. It’s a source of truth for our portfolio KPIs,”
Ana Pinheiro – Operations Manager
“It’s really good to have a centralized place for portfolio reporting. And more positively, we can invite companies into Rundit and they can use the tool with other investors as well.”
Diogo Cristofolini – Investment Analyst
“Using Rundit saves us time, as we are able to pull out all portfolio data from one place instead of dealing with multiple different Excel files.”
Kristina Lunnas – CFO & Operations Director
Get holistic insights and make decisions from a unified data source.
Last updated: January 7th, 2025