
🔎 How do you know whether your company is performing as it should? Missing a single source of truth for both forecast and actual KPIs? 👉 We are excited to introduce the Forecasts vs Actuals feature – a faster way to establish goals and predict every phase of business growth. This new feature will make the forecasted vs. actual reporting convenient and the comparison between these numbers becomes simple and transparent.
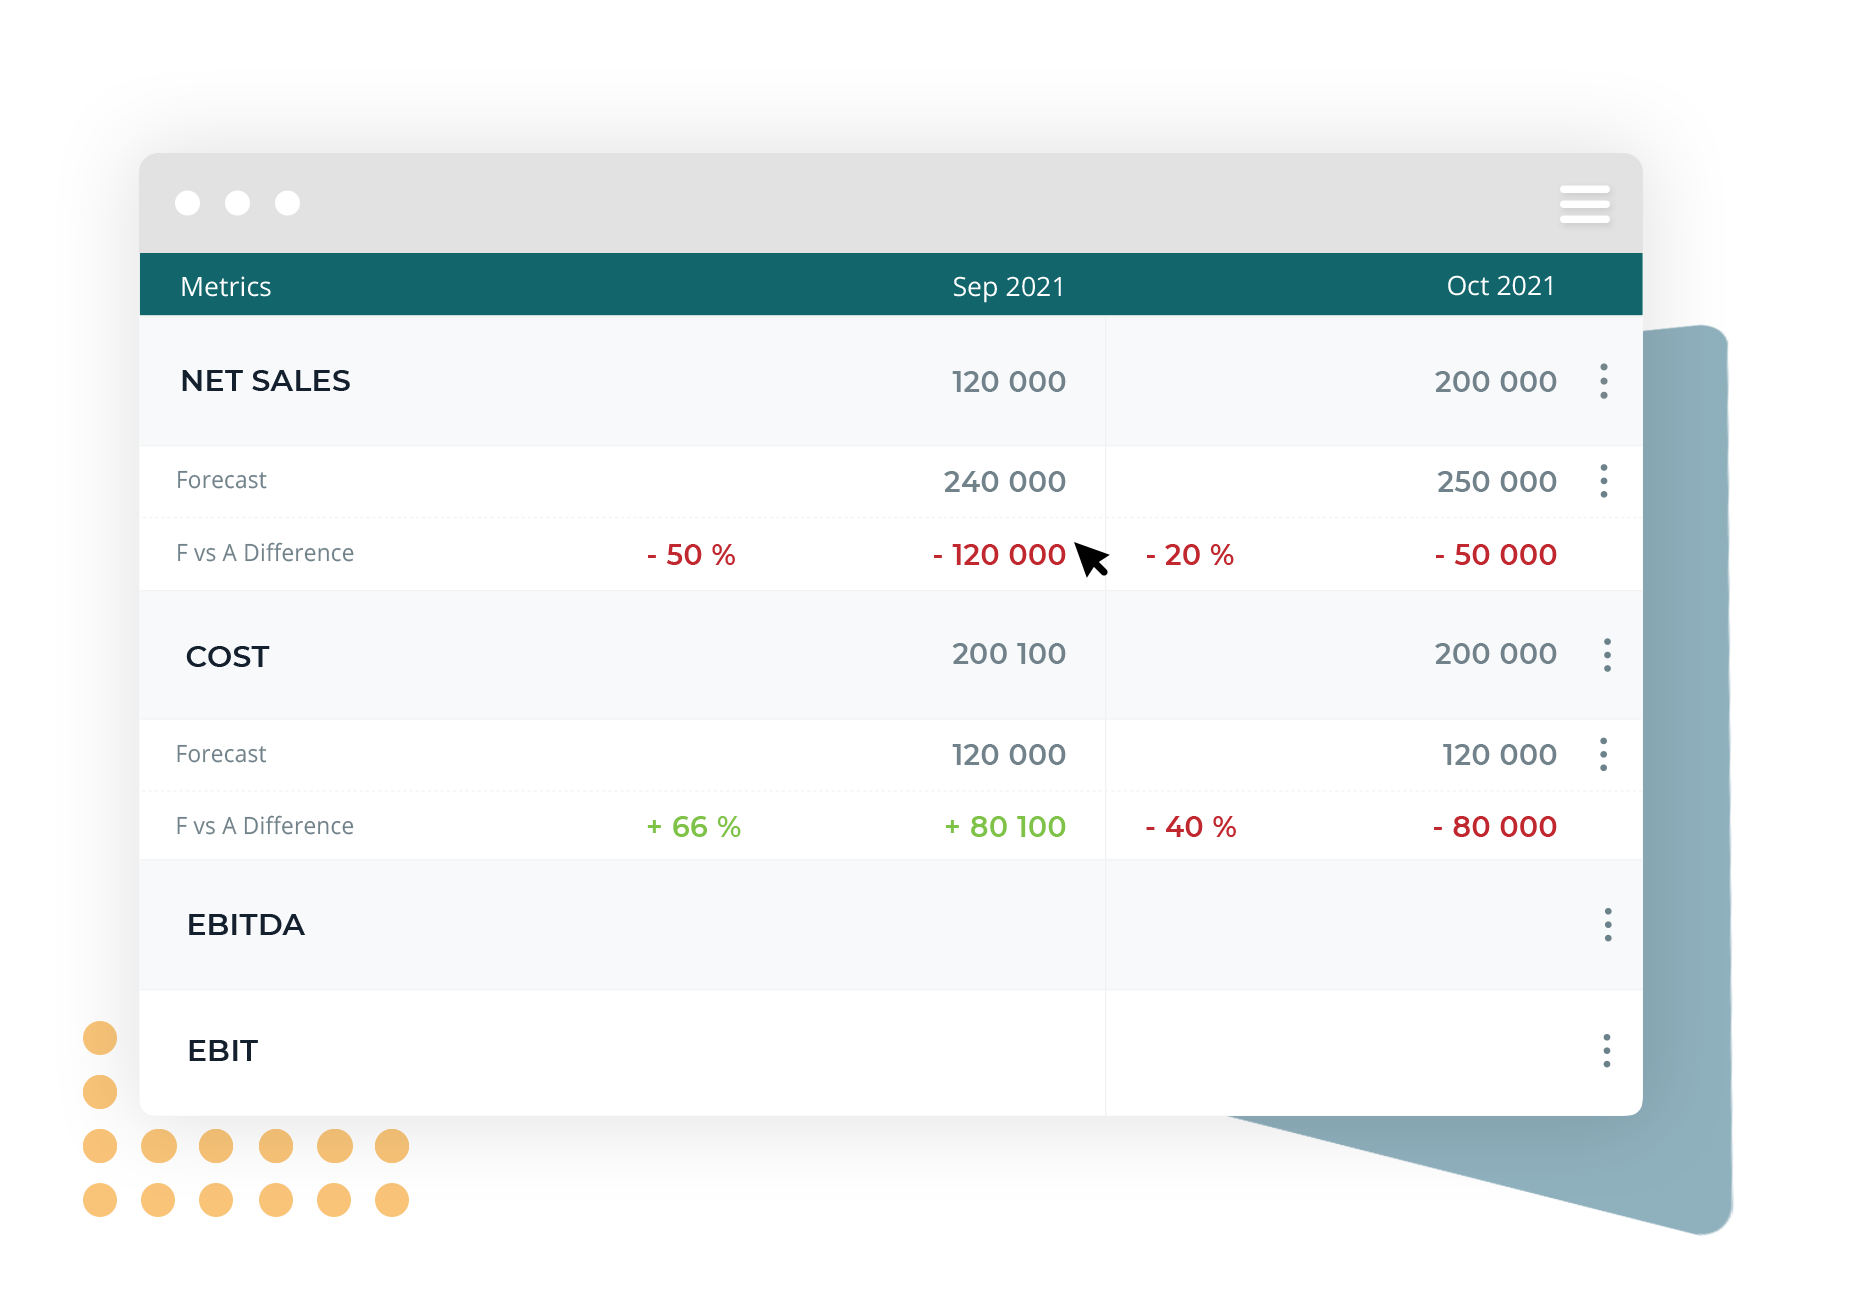
Investors and companies are now able to add a forecast subrow for every KPI on the company metrics table. When you have entered both forecast and actual values, Rundit will automatically show the difference between the forecasted value and actual value. The forecast will be automatically used to be displayed across the Rundit platform in the dashboards (and on the LP report when it’s launched) for investors.
💡 Create a new investor group, e.g. “prospects” in Rundit. Insert forecast KPIs into your metrics table and invite potential investors to view your company’s predicted growth. Manage your investor permissions to select which KPIs you’d like the potential investors to have access to.
Forecasts matter. It’s critical for companies to establish goals and predict every phase of business growth. Not to mention investors for whom thoroughly considered forecast KPIs are crucial especially in startups, where there’s often only a little or no historic data available.
Enjoy the new features!
If you’re a VC looking for a closer introduction to the Rundit platform, don’t hesitate to book a call here.


Get holistic insights and make decisions from a unified data source.